

For those of you who know me well, it won’t be surprising to you that I have been collecting data every day to be able to analyze how the trip is going. Before we left on the trip, I anticipated some of the questions I would be asked throughout our travel and when we got back: where was your favorite place? and why?
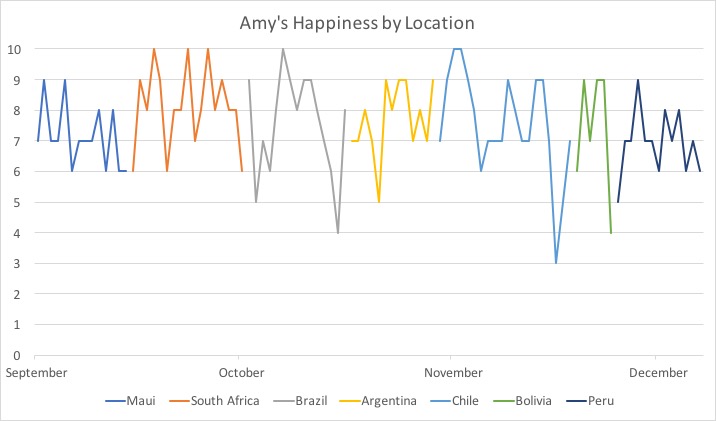
I imagine that most (normal?) people just go with their gut. They have a sense of where they enjoyed the most but that can be distorted with time and different circumstances. So, I decided I would track our happiness each day with a score out of 10 (a validated scale for gauging someone’s happiness) and then find out how strong the correlations were between our happiness levels and factors like what the weather was like, whether or not we were with friends/family, and how much money we spent each day. Don’t worry, I know that correlation is not causation but a randomized control trial (RCT) wasn’t feasible under these circumstances because neither Nate nor I were willing to agree to creating experimental and control groups, so correlation will just have to do.
I’ll be summarizing the data for each continent as we go and then hope to have a snazzy graphical analysis of the whole trip at the end (I know, you can hardly wait). This analysis is for South America but also includes our time in South Africa because we won’t get any more data for Africa until the end of the trip when we get to Mauritius.
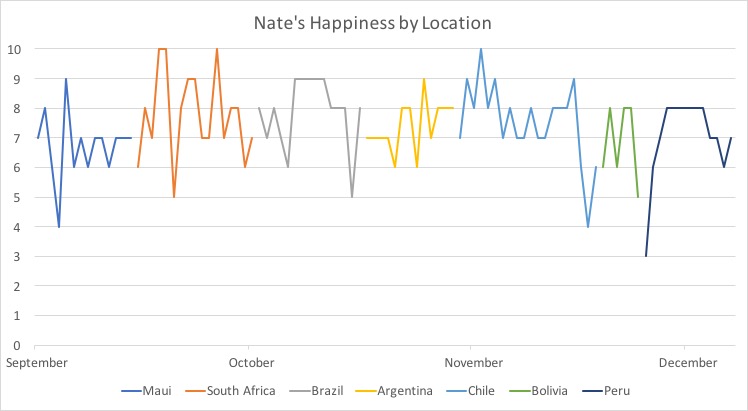
Using a scale from 1-10 with 10 being that the day couldn’t have been any better, I had 6 days that were perfect 10s over the first three months of the trip and Nate had 4.
Amy’s Perfect 10s: the day we climbed Table Mountain, the day at the Old Buiscuit Mill and doing gin tasting in Cape Town, the first night on the overnight train from Cape Town to Johannesburg, hiking Sugar Loaf in Rio, and two days of exploring on Easter Island.
Nate’s Perfect 10s: hiking Table Mountain, the day we did a wine tour in Stellenbosch, the first night on the train from Cape Town to Johannesburg, and the day we took the ATV around Easter Island.
Looking at these, it seems there is a bias towards earlier places on the trip. Over 50% of my happiest days were in Cape Town and 75% of Nate’s were. It may be that with time, it takes more to be really perfect when you’re seeing cool new places everyday.
Interestingly, if we take the average of the happiness scores across the days we spent in each place Nate and I agree on the overall happiest place, yet neither of us had “perfect 10” days there: Ilha Grande.
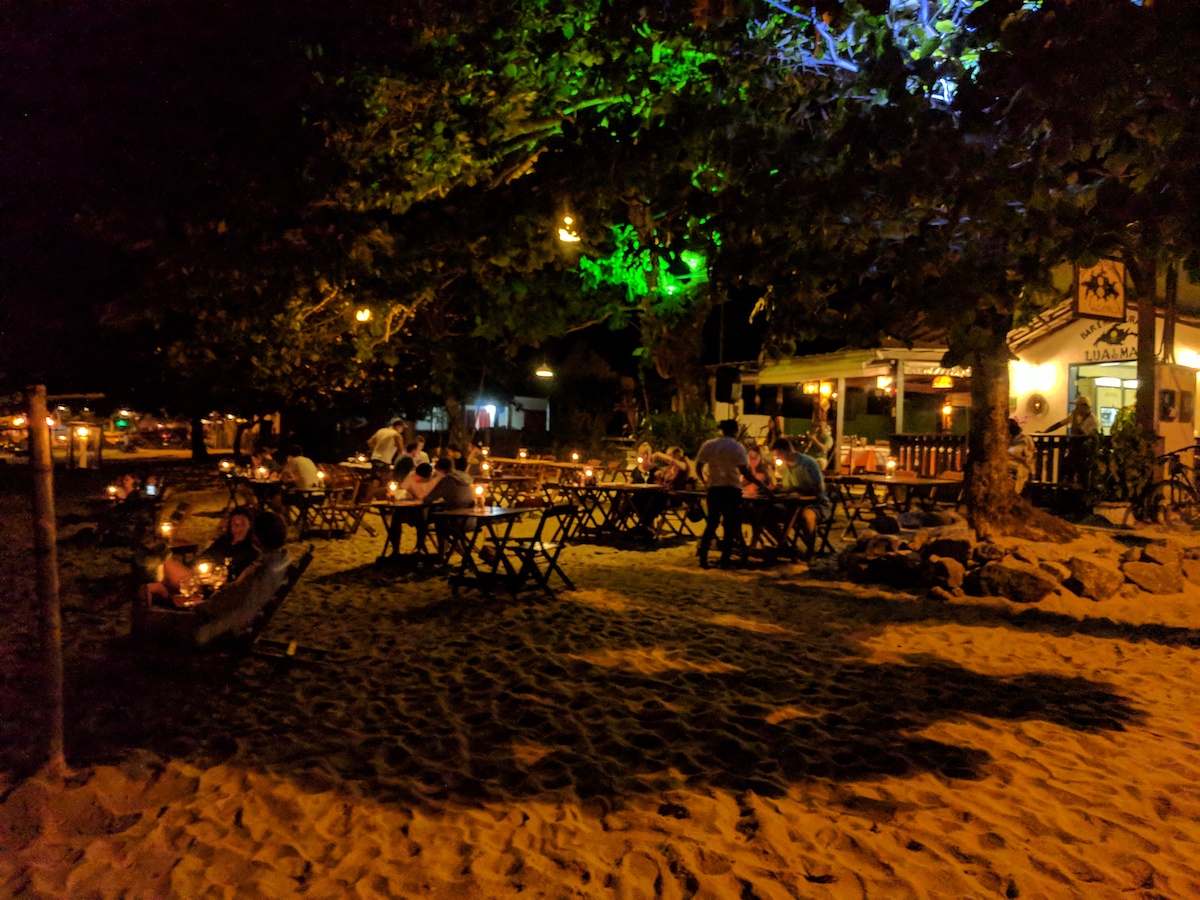
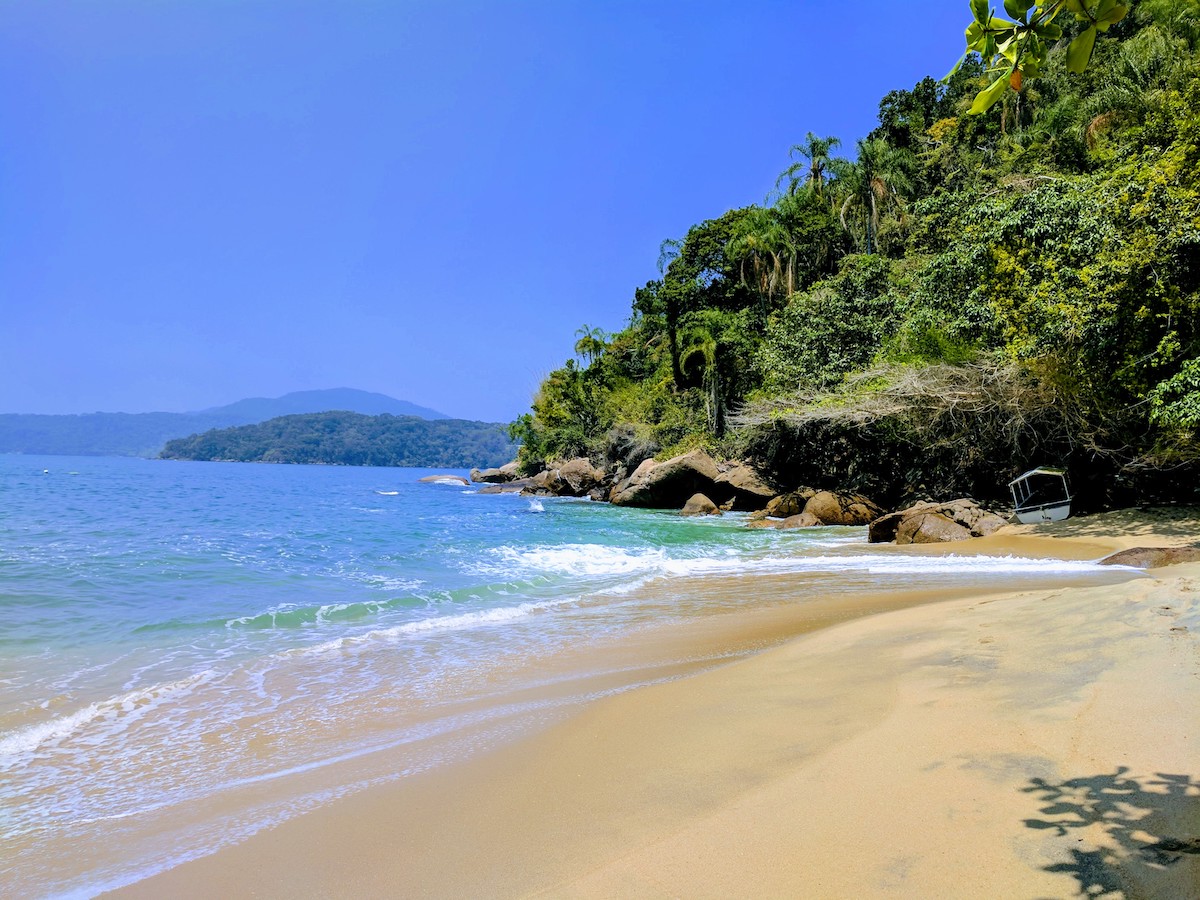
Ilha Grande was a relaxing getaway with beautiful beaches, lots of hiking, and great food.
| Amy | Nate |
|---|---|
| Ilha Grande | Ilha Grande |
| Easter Island | Easter Island |
| Cape Town | Rio |
| Lowest Scoring: | |
| Amy | Nate |
| Puno | Puno |
| Paraty | La Paz |
| Sao Paulo | Lima |
Based on the data I’ve collected so far, there are a couple of interesting correlations and some things I thought would have strong correlations but didn’t.
The strongest correlation, probably not surprisingly, was between Nate’s happiness on any given day and my happiness (r=0.70). It turns out that either the same types of things make us happy or having a happy partner makes it easier to be happy.
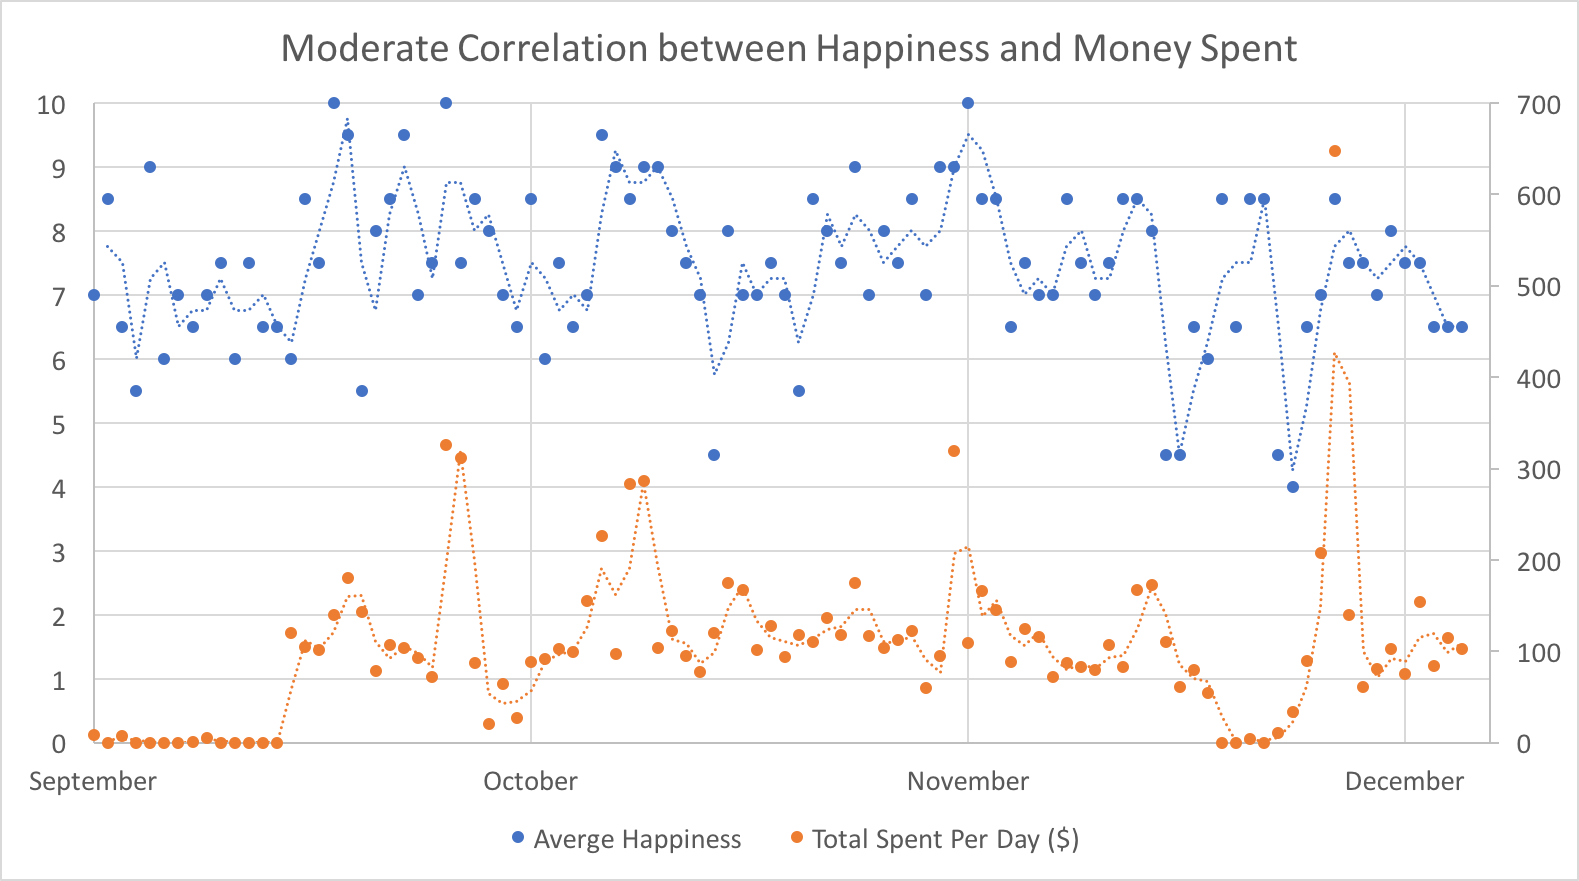
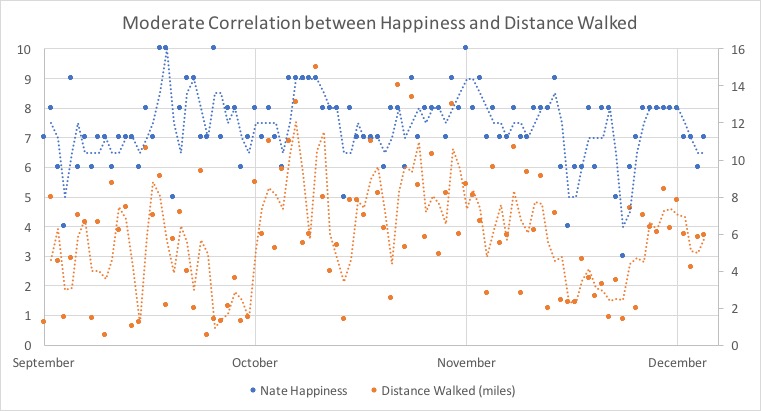
Other moderately strong correlations included the amount of money we spent, though it was stronger for me (r=0.35) than Nate (r=0.30). For Nate the distance we walked in a given day had a stronger correlation with his happiness score (r=0.36) compared to me (r=0.25) Part of the walking score could be that travel days are typically not some of our happiest and also happen to be the days we do the least walking, what with our sitting on planes for good chunks of the day. It could also be explained by the days we did a lot of hiking were generally happier days and that spending time outdoors makes him happier than days when I take him to museums.
Surprisingly to me, there was not a strong correlation for me between my happiness and days I was sick (r=-0.18). I had a couple of bouts of stomach bugs and I remember them being quite unpleasant but overall the correlation is quite weak. For Nate it was moderately strong (r=-0.33). When possible, we tried to push through on our sick days to still do some adventuring but I would have expected the correlation to be much stronger.
I also would have thought that time spent with friends and family would have led to strong spikes in happiness but it was also quite weak (Amy r=0.10, Nate r=0.11). It’s not to say that we don’t enjoy the time we spent with our friends and family as we traveled but it is possible that the days we hit some of our bucket list items (Amy r=0.27, Nate r=0.15) meant higher happiness scores. Maybe it is because those days are more novel, even though I remember enjoying time sitting in conversations with friends and family as very happy moments.
Weather also seemed to have little to not effect on our happiness (Amy r=-0.11, Nate r=-0.15). This might be because the weather overall was good for us with an average high across the whole time period of 74 degrees. If e experienced more variety, maybe there would have been a stronger link.
So what do we take away from this so far? Money to some extent may be able to buy happiness… at least doing some big things (like visiting Machu Picchu or going horseback riding) that cost more than eating snacks from street vendors can make you happier. Or maybe we are happier in places that are more expensive, which are usually more developed urban cities. That’s the problem with correlation, it can’t give you any of the drivers you’re looking for.
We might also want to make sure we do plenty of walking to keep Nate happy. In general that hasn’t been an issue but we’ll see what Southeast Asia brings.