

I can’t believe it is over.
I’m still working through a pretty big case of denial but to help me process I’m crunching all the data we collected each day of this crazy adventure. For those of you who missed the first Nerd Time post or my midpoint review, we have been collecting data every day to be able to analyze how the trip is going. Now that the end has come, this will be a reflection of a year that is hard to put into words.
Crunching numbers is not enough to describe this wonderful adventure though, so I am also writing a more personal reflection. As you can imagine, the feelings part is a little less straightforward to put together. So stay tuned for the more squishy post about how I feel about the last year of travel and what comes next.
Over the last 347 days, we visited 33 countries and 73 cities.

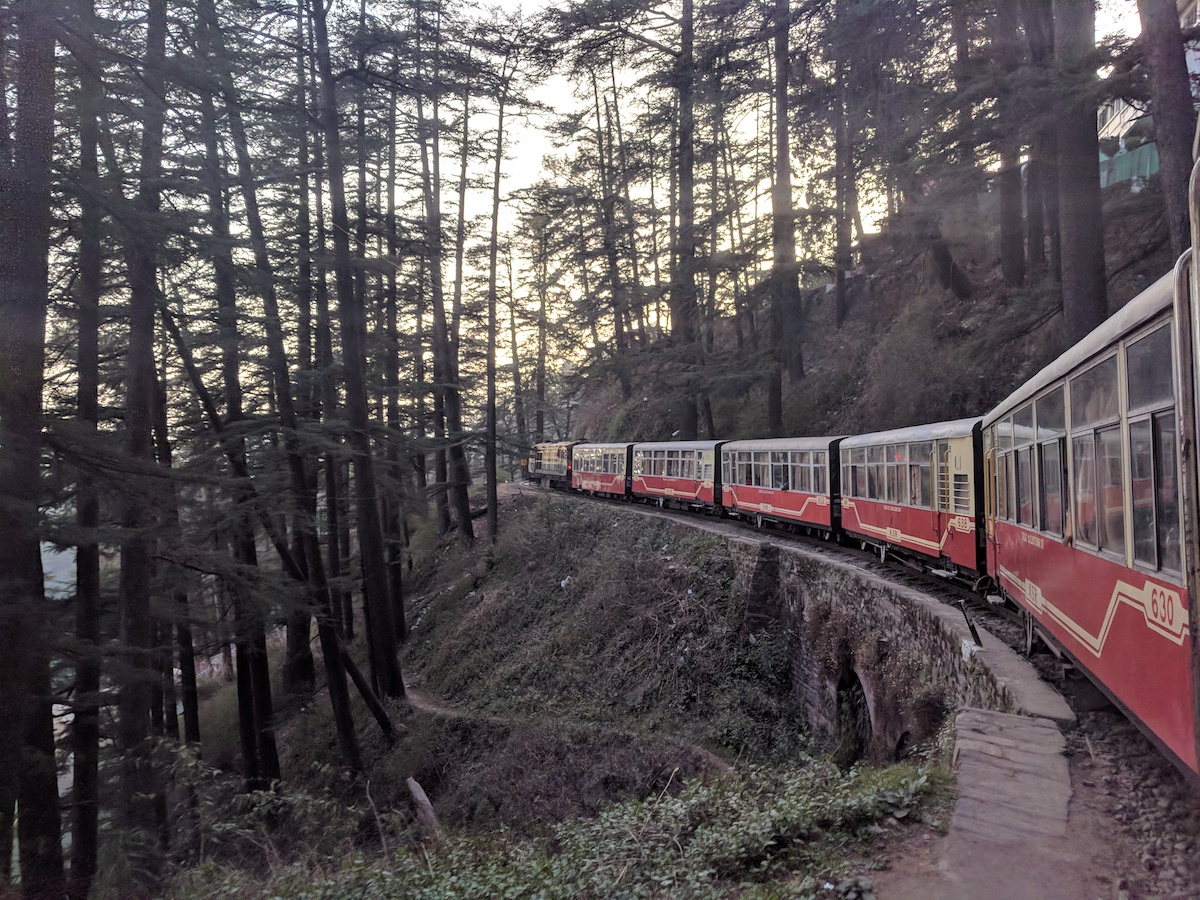
Going so many places means that we’ve gone a long way. To be exact, we’ve:
(All values as of August 13th, 2018 when we landed in Reno)
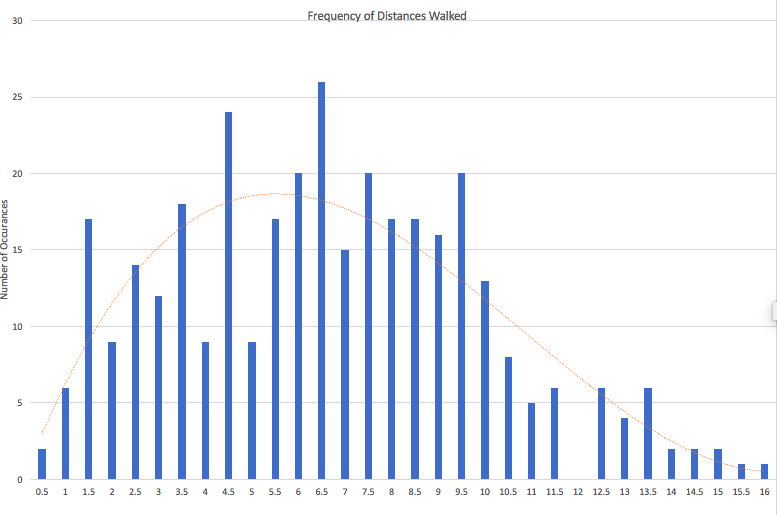
We did a lot of moving around but we really enjoyed walking around. We averaged 6.3 miles per day, not eliminating days spent on planes or on trains when we don’t have a chance to add miles. There were a good number of days where we walked more than 10 miles in a day and one day where we walked a crazy 16 miles.
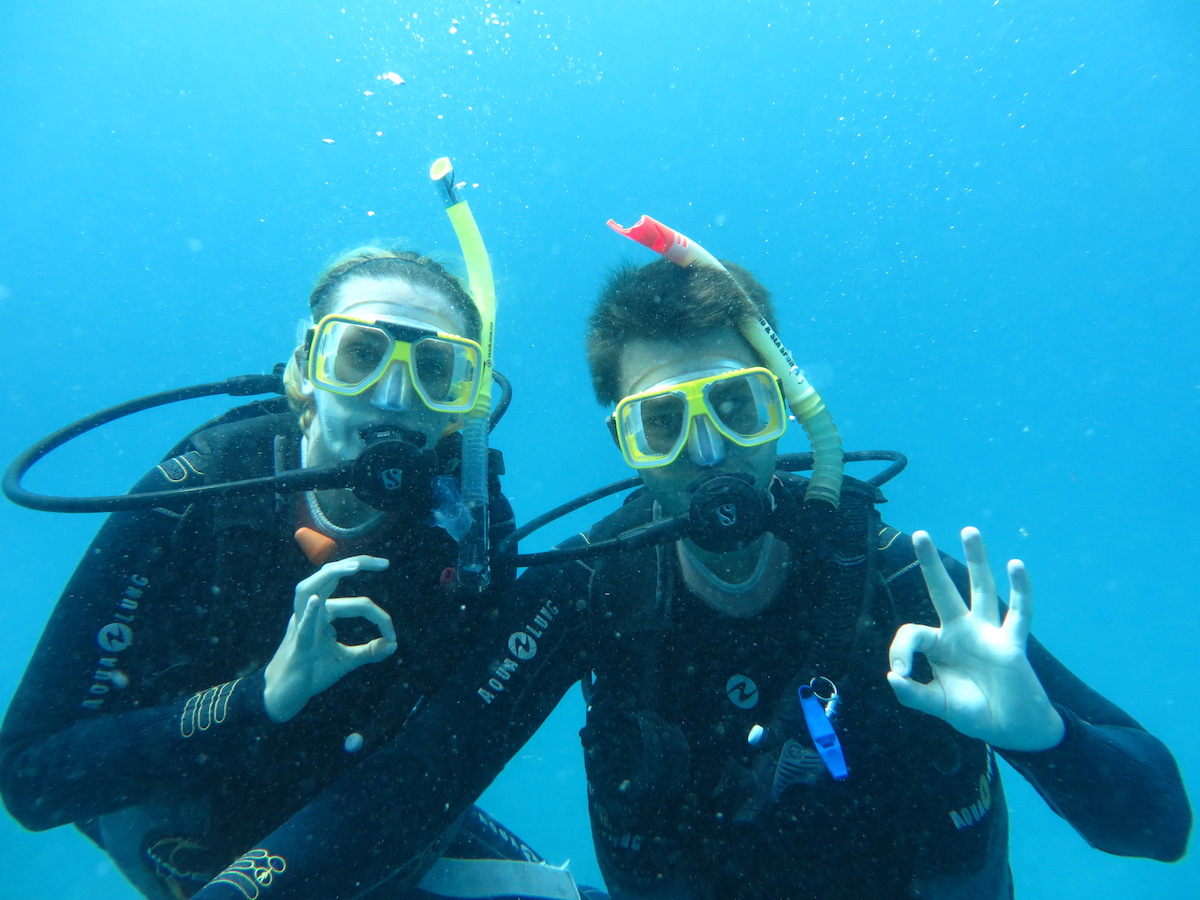
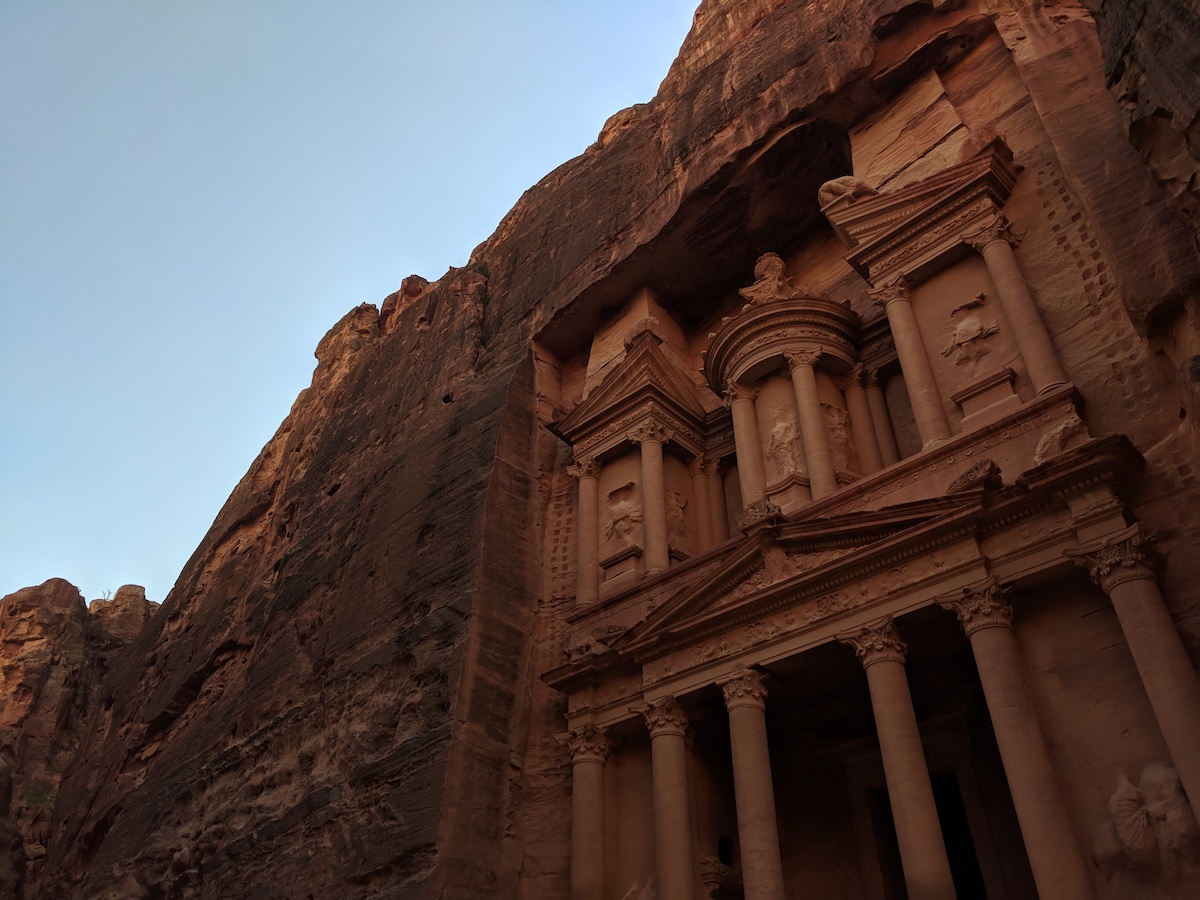
Loving diving the Great Barrier Reef and the desert of Jordan.
| Amy | Nate |
|---|---|
| Cairnes, Australia | Cairnes, Australia |
| Wadi Musa, Jordan | Wadi Musa, Jordan |
| Easter Island, Chile | Ilha Grande, Brazil |
| Ilha Grande, Brazil | Easter Island, Chile |
| Siem Reap, Cambodia | Osaka, Japan |
| Lowest Scoring: | |
| Amy | Nate |
| Puno, Peru | Puno, Peru |
| Varanasi, India | Cuzco, Peru |
| Phnom Pehn, Cambodia | Jaisalmer, India |
| Mandalay, Myanmar | Santiago, Chile |
| Dehli, India | Varanasi, India |
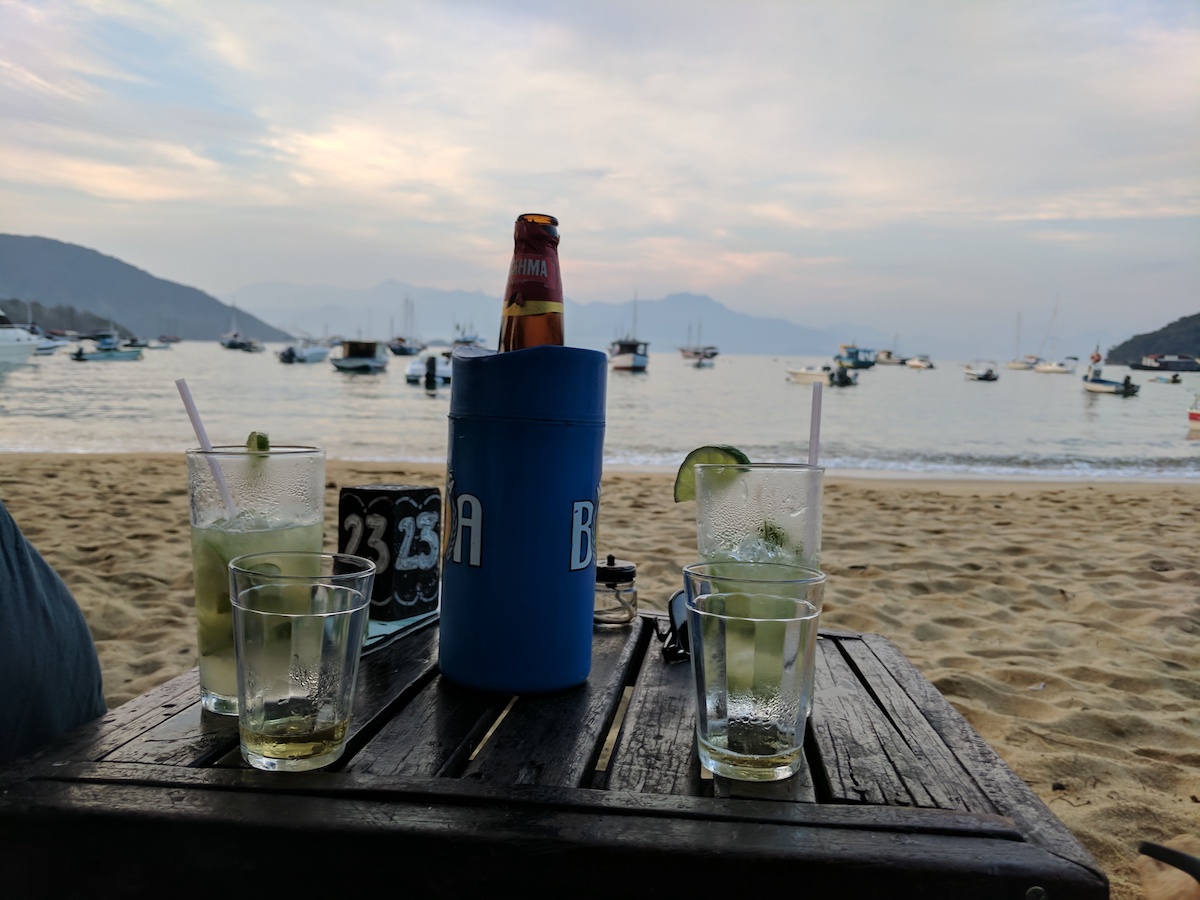
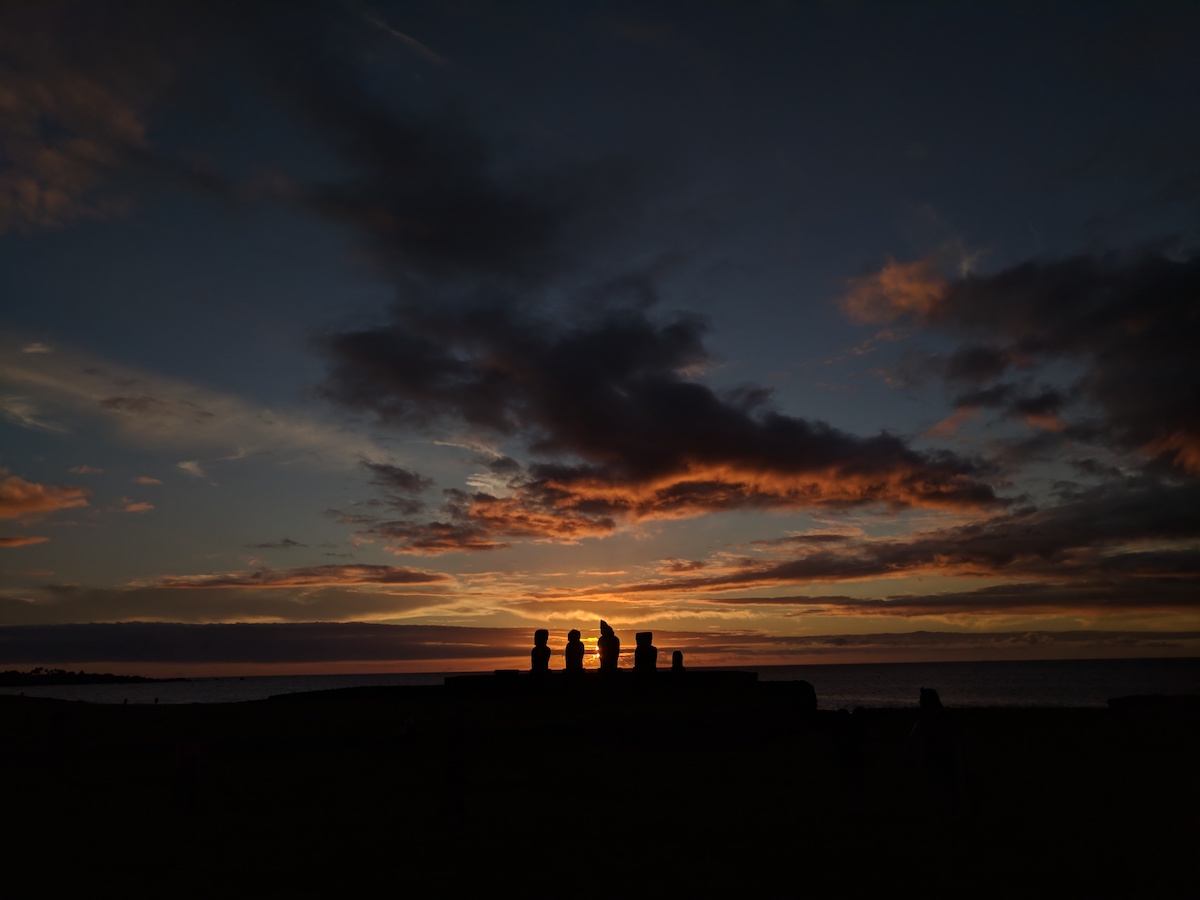
Great moments from Ilha Grande and Easter Island.
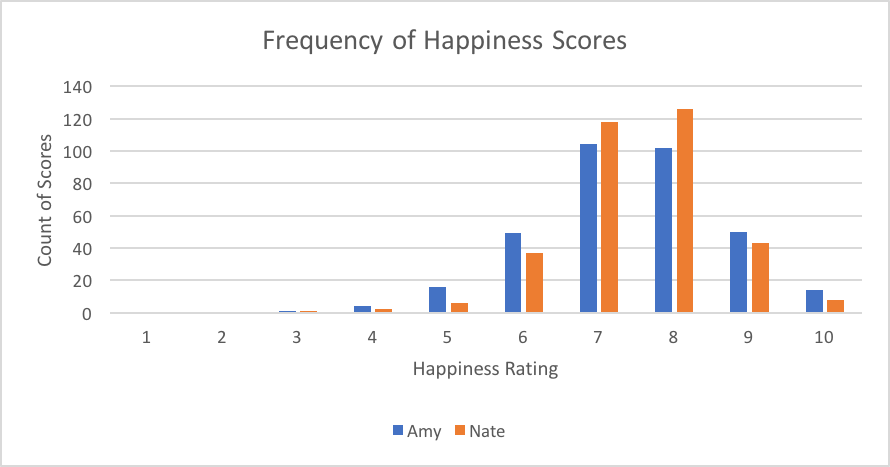
Each morning we rated our happiness for the day before on a scale of 1 to 10. So for 347 days we have a rating of how we felt about the day. This isn’t a perfect way to reflect, as it’s obviously subjective and we definitely saw a trend of being more generous with our scores as the trip went on, but it makes for an interesting way to reflect on our experiences.
We tracked our happiness every day on a scale of 1 to 10.
For both Nate and I, our least happy days, not surprisingly, were days we were sick. I had more bad days then Nate, even though I was sick less frequently. One of my worst days was what I’ll call “the pit” of my silent meditation retreat in Thailand, when I thought about giving up and leaving but pushed through. Another chunk of my bad days came in India. I wasn’t sick but I wasn’t enjoying myself very much either.
On the other end of the spectrum, I had 14 “perfect 10” scores and Nate only had 8. So, my lows may have been lower but my highs came more frequently too.
Some of my perfect 10 days were doing the food tour I am obsessed with in Rio, exploring the temples of Siem Reap, visiting the Kuang Si waterfalls in Laos, trekking through Petra, hiking in Sardinia, and of course getting to see Hamilton in London.
We both had perfect days when we hiked Table Mountain in Cape Town, took a luxury train ride from Cape Town to Johannesburg, explored Easter Island, and dove on the Great Barrier Reef.
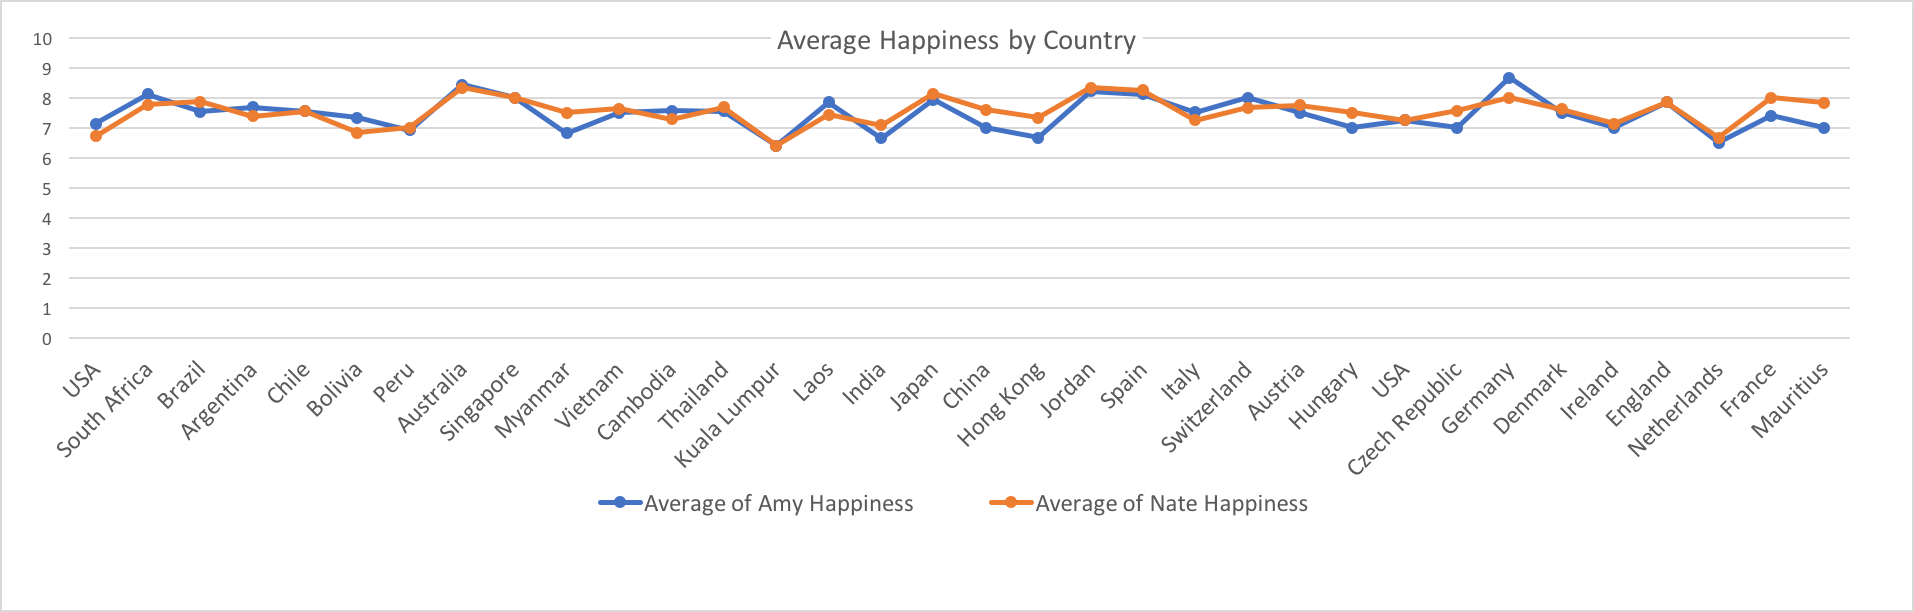
Even though there were many more fluctuations, when you look at the average of our happiness in each country over the course of the trip, it is remarkably stable and high. We were very lucky in so many ways and I think these scores reflect that. We were sick but not too sick, we didn’t get hurt, we didn’t have any issues missing flights or trains, we didn’t get robbed. Most everything went according to plan and we got to see and do a lot of amazing things. Who wouldn’t be pretty happy?
The other aspect of tracking our happiness was that I wanted to find out what factors effected our happiness most. So I tracked a lot of other things to study.
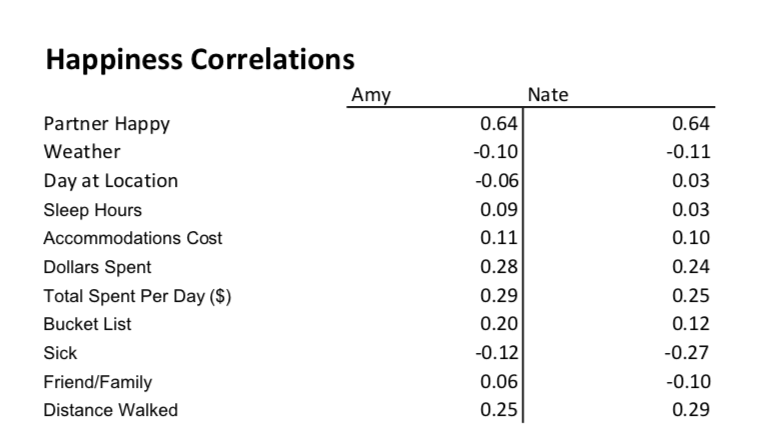
You can see that for most things, our correlations were not significant (even using a bar of 0.20, which is low even for social science research).
By far the strongest correlation was between Nate’s happiness and my own. Happy partners make for happy partners it turns out. Or maybe we like and dislike the same sorts of things. Still, it seems positive that we could agree most of the time about how well a day went. With us spending so much time together the trip might have turned out pretty differently if this hadn’t been the case.
Other strong correlations included how far we had walked and how much we spent overall. These were fairly constant throughout the trip. Turns out spending money can potentially make you happy, though spending money on accommodations had a weaker relationship than day-to-day spending with our happiness. Unsurprisingly, being sick had a negative relationship with happiness. Luckily we really were not sick very often. I was sick only 18 days (5% of the trip) and Nate for 27 days (8% of the trip). Given how much we pushed ourselves sometimes, how many new things we ate, and how many times we were assured we’d be terribly ill this wasn’t too bad.
Travelling for so long is no small feat and it is by no means cheap. We put together our first theoretical budget in 2013, while I was still in graduate school, to see how much we were going to need to save to pull this off. Our budgeting process was extremely thorough and we tracked every single penny we spent leading up to and on the trip. We tracked a total of 1,668 unique purchases. We broke down spending based on whether Nate or I paid for each purchase so we could make sure we were keeping the spending equitable. At the end of over 11 months, Nate and I ended the trip within 15 USD of evenly splitting all the costs of the trip.
Compared to our budget, we ended up spending 5 percent less than we had planned. Much of this savings was driven by our under-spending on entertainment, though about half of that surplus was offset by our overspending on food. Turns out we like eating more than most other things and it often made up our entertainment for the day as well.
We also saved a significant amount within our budget for side-trip travel (i.e. all travel other than our RTW ticket), most of which was generated by booking all of our trains through Europe as soon as the schedule opened 2-3 months ahead of time. We ended up spending less than we would have with a rail pass, though obviously had to give up some flexibility for that privilege.
One category of savings we were very lucky to still have was what we called our contingency budget for handling any sort of problems that came up along the way. We envisioned this as a way to pay for replacing clothes if our luggage was lost or paying for a doctors visit if we got injured (but not so badly as to activate the measures covered by our travel insurance). It was just lucky that we didn’t have to use any of these funds while we were on the trip. I’m glad we had them as a mental safety blanket though.
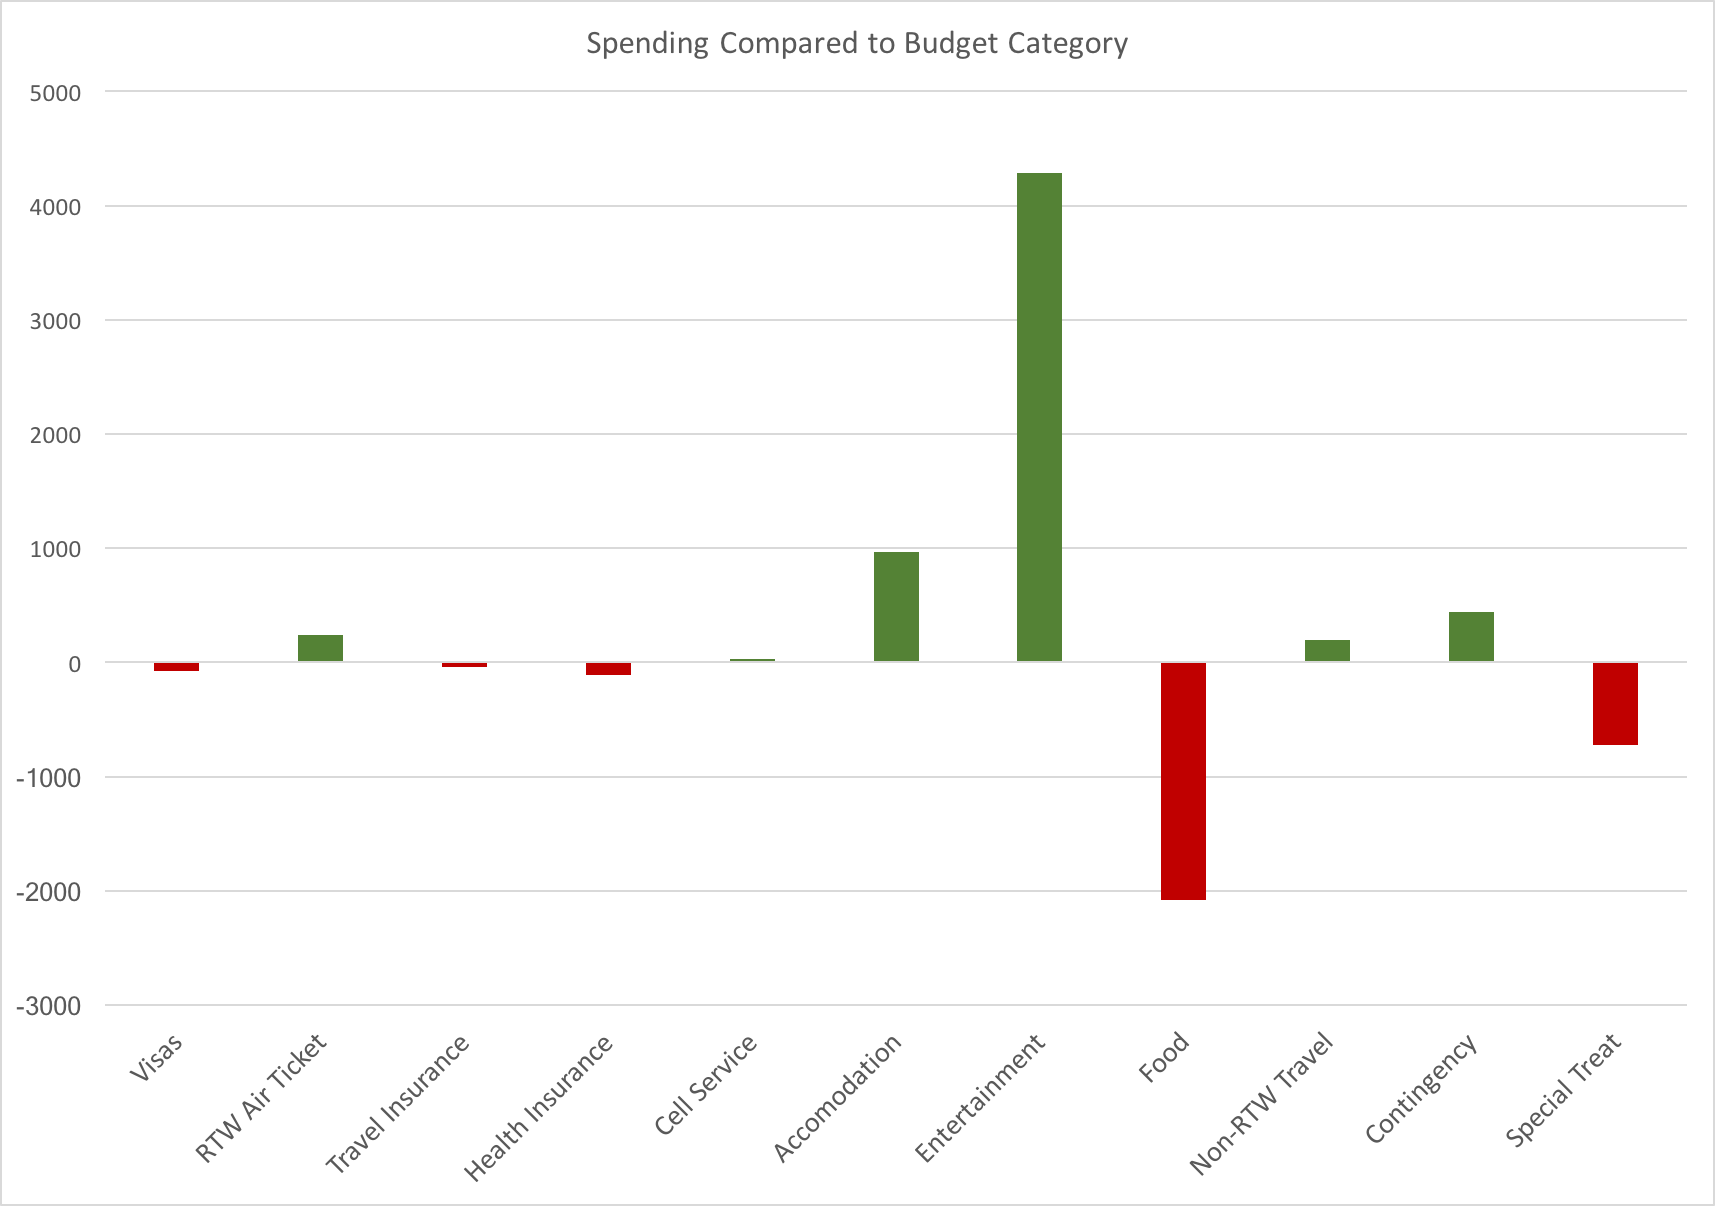
Our surplus (or overspending) by category.
Because of our tracking, we could also break-down our expenses by country. We ended up being under-budget more often than not, with huge savings in South Africa because we skipped cage diving with great white sharks. We went over budget in a few places too. Peru and Australia were almost entirely due to the big ticket items (Machu Picchu and Great Barrier Reef diving) that had big price tags and ended up being more than we originally budgeted. In other places, it was the cost of accommodations that threw off our estimates or extra intentional splurges like our last minute trip to see Hamilton and Wicked while we were in London.
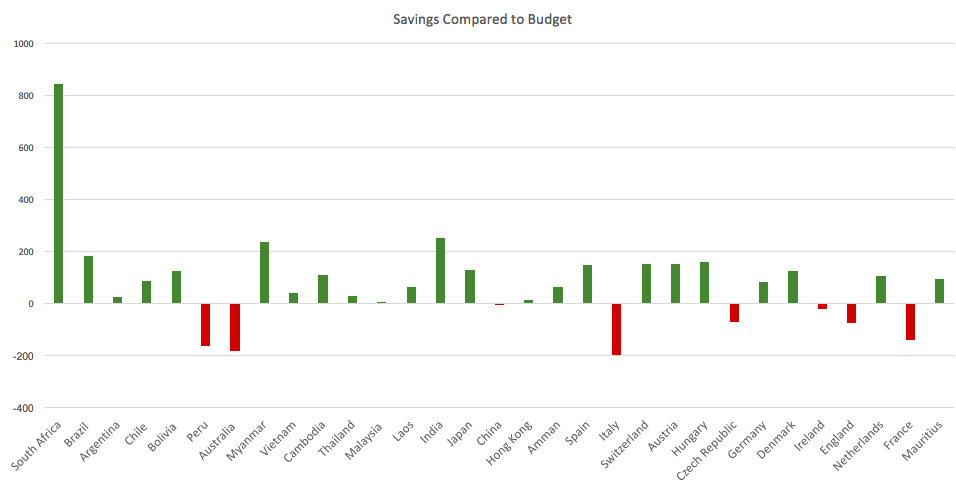
Our surplus (or overspending) by country.
| Australia |
| Japan |
| France |
| Spain |
| Italy |
| Least Expensive Places: |
|---|
| Thailand |
| Hungary |
| Laos |
| Vietnam |
| India |
Overall, our most expensive days were the day we visited Machu Picchu, days diving the Great Barrier Reef, and the day we went to see Hamilton. Machu Picchu may have been a rainy mess when we were there but even so each of these memories are some of our favorites on the trip and I wouldn’t go back in time and skip them just because of their costs.
A somewhat random way we ended up saving a not insignificant amount of money was researching debit cards that refunded ATM fees. We used a Charles Scwhab card that ended up being great. In many countries we visited, using a credit card wasn’t an option so we were taking out cash. Having a card that refunded all ATM fees saved us 335 USD over the course of the trip, which just for fees is a huge amount. The effort it took to apply was definitely worth it.
A fun extra is that I’ve read 43 books and 18,313 pages over the course of the trip. If you’re looking for recommendations, my favorites (in no particular order) were:
I get some funny looks when I describe to people all the spreadsheets we’ve made and data we’ve tracked over the last year. I know it seems crazy (at least to most people) but all these data make this crazy adventure just a little more concrete. Budgeting in such detail also took the stress out of so many decisions. We didn’t have to wonder if we splurged on a nice dinner if we were going to ruin our budget, we could plug in the cost of whatever we wanted into our spreadsheet and see what the effect would be. So deciding any number of things we were going to do became so much easier! It really took my budget nerdiness to a whole different level. It has also helped me process and I think it’s made us reflect more as we went than we might have otherwise. There will be a few more posts about how we felt about this adventure but I hope you get some joy from how big of a nerd I am.